Stress testing
Stress testing is all about extremes. We are trying to see at which point the system will break. Knowing when a system fails allows us to know why it failed which in return allows us to see how we can deal with the bottleneck.
Is the problem the database? Is it CPU? Is it memory? Is it network bandwidth? Stress testing can answer all these questions.
As someone who has worked in e-commerce and in payment, I can tell you that we used to run stress tests all the time. The reason why was because we needed to know how the system would ask in similar situations. Black Friday was the reason why we had to do it in our case. Note that stress testing isn't about instant extreme load. This is Spike Testing, a different flavour of Stress testing, and we will cover it later. In our case, the traffic is gradual but does get extreme.
Stress testing our system can tell us:
- How the system will fail (or not fail) during extreme load
- What is the maximum amount of users or throughput our system can handle before failing
- What happens once the system fails (for example will the application restart automatically?)
Implementing a stress test
The code for the stress testing is very similar to load testing, however there are two main differences.
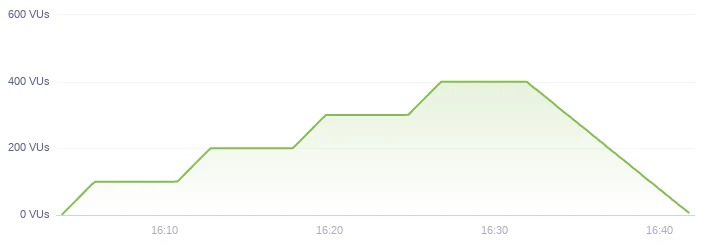
Firstly, our stages will be broken down to 5 main steps:
- Below normal load
- Normal load
- Around considered breaking point
- Past considered breaking point
- Recovery stage, ramp-down
stages: [
    { duration: '2m', target: 100 },
    { duration: '5m', target: 100 },
    { duration: '2m', target: 200 },
    { duration: '5m', target: 200 },
    { duration: '2m', target: 300 },
    { duration: '5m', target: 300 },
    { duration: '2m', target: 400 },
    { duration: '5m', target: 400 },
    { duration: '10m', target: 0 },
]
Second, we can introducing request batching by using http.batch to send multiple requests at once to the system.
const responses = http.batch([
    ['GET', `${BASE_URL}/customers/`, null],
    ['GET', `${BASE_URL}/customers/`, null],
    ['GET', `${BASE_URL}/customers/`, null],
    ['GET', `${BASE_URL}/customers/`, null],
]);

responses.forEach(x => {
    const customers = x.json();
    check(customers, { 'retrieved customers': (obj) => obj.customers.length > 0 });
})
sleep(1);
This is what the results look like:
          /\      |‾‾| /‾‾/   /‾‾/
     /\  /  \     |  |/  /   /  /
    /  \/    \    |     (   /   ‾‾\
   /          \   |  |\  \ |  (‾)  |
  / __________ \  |__| \__\ \_____/ .io

  execution: local
     script: ./stress-test.js
     output: -

  scenarios: (100.00%) 1 scenario, 400 max VUs, 7m50s max duration (incl. graceful stop):
           * default: Up to 400 looping VUs for 7m20s over 9 stages (gracefulRampDown: 30s, gracefulStop: 30s)

running (7m20.9s), 000/400 VUs, 99576 complete and 0 interrupted iterations
default ✓ [======================================] 000/400 VUs  7m20s

     ✓ retrieved customers

     checks.........................: 100.00% ✓ 398304     ✗ 0
     data_received..................: 113 MB  256 kB/s
     data_sent......................: 18 MB   41 kB/s
     http_req_blocked...............: avg=7.93µs  min=0s      med=0s     max=21.49ms p(90)=0s     p(95)=0s
     http_req_connecting............: avg=437ns   min=0s      med=0s     max=4ms     p(90)=0s     p(95)=0s
   ✓ http_req_duration..............: avg=2.04ms  min=284.5µs med=1.85ms max=29.5ms  p(90)=3.45ms p(95)=3.99ms
       { expected_response:true }...: avg=2.04ms  min=284.5µs med=1.85ms max=29.5ms  p(90)=3.45ms p(95)=3.99ms
     http_req_failed................: 0.00%   ✓ 0          ✗ 398304
     http_req_receiving.............: avg=34.52µs min=0s      med=0s     max=7.89ms  p(90)=44.8µs p(95)=364µs
     http_req_sending...............: avg=32.9µs  min=0s      med=0s     max=9.49ms  p(90)=0s     p(95)=376.3µs
     http_req_tls_handshaking.......: avg=7.41µs  min=0s      med=0s     max=20.49ms p(90)=0s     p(95)=0s
     http_req_waiting...............: avg=1.97ms  min=0s      med=1.66ms max=29ms    p(90)=3.39ms p(95)=3.96ms
     http_reqs......................: 398304  903.438429/s
     iteration_duration.............: avg=1s      min=1s      med=1s     max=1.03s   p(90)=1s     p(95)=1s
     iterations.....................: 99576   225.859607/s
     vus............................: 3       min=3        max=400
     vus_max........................: 400     min=400      max=400
And this is the chart of what the traffic looks like:
Results interpretation
We can use the result of our stress test to break down how the system behaved in 4 main way:
- Excellent: System performance did not degrade. Response times were similarly load between high and load traffic
- Good: System performance degraded in terms of response time but all requests were handled sucessfully
- Poor: System produces error during the spike but recovers during the low-traffic stage
- Bad: System crashes and doesn't recover even after the traffic is gone.
Spike Testing
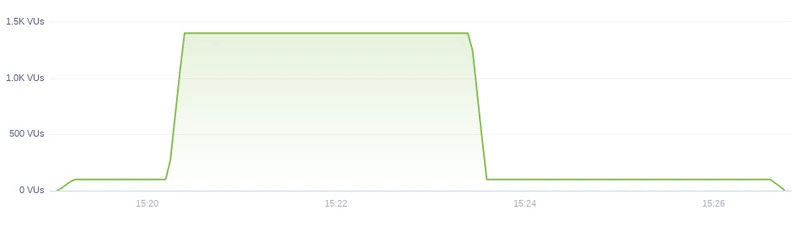
Spike Testing is a type of Stress Testing that aims to overwhelm the system with users immediately and see how the system acts. No warmup time, no ramp-down time. Instant traffic.
Examples of such traffic can be the release of items such as iPhones, Steam Decks or new Graphics Cards that make people visit websites and put in orders in the thousands.
The stages are usually:
- Ramp-up to below normal traffic in 10 seconds
- Stay there for 1 minute
- Spike to extreme load (way more than the peak of stress testing) in 10 seconds
- Stay there for 3 minutes
- Scale down to below normal load in 10 seconds
- Stay there for 3 minutes
- Ramp-down to 0 users in 10 seconds
stages: [
    { duration: '10s', target: 100 },
    { duration: '1m', target: 100 },
    { duration: '10s', target: 1400 },
    { duration: '3m', target: 1400 },
    { duration: '10s', target: 100 },
    { duration: '3m', target: 100 },
    { duration: '10s', target: 0 },
  ]
Here are the results of this test:
          /\      |‾‾| /‾‾/   /‾‾/
     /\  /  \     |  |/  /   /  /
    /  \/    \    |     (   /   ‾‾\
   /          \   |  |\  \ |  (‾)  |
  / __________ \  |__| \__\ \_____/ .io

  execution: local
     script: ./spike-test.js
     output: -

  scenarios: (100.00%) 1 scenario, 1400 max VUs, 8m10s max duration (incl. graceful stop):
           * default: Up to 1400 looping VUs for 7m40s over 7 stages (gracefulRampDown: 30s, gracefulStop: 30s)


running (7m40.5s), 0000/1400 VUs, 290413 complete and 0 interrupted iterations
default ✓ [======================================] 0000/1400 VUs  7m40s

     ✓ retrieved customers

     checks.........................: 100.00% ✓ 1161652     ✗ 0
     data_received..................: 330 MB  717 kB/s
     data_sent......................: 53 MB   114 kB/s
     http_req_blocked...............: avg=10.68µs min=0s med=0s     max=41.5ms  p(90)=0s      p(95)=0s
     http_req_connecting............: avg=661ns   min=0s med=0s     max=18.5ms  p(90)=0s      p(95)=0s
   ✓ http_req_duration..............: avg=4.22ms  min=0s med=3.5ms  max=50.99ms p(90)=7.99ms  p(95)=9.99ms
       { expected_response:true }...: avg=4.22ms  min=0s med=3.5ms  max=50.99ms p(90)=7.99ms  p(95)=9.99ms
     http_req_failed................: 0.00%   ✓ 0           ✗ 1161652
     http_req_receiving.............: avg=33.6µs  min=0s med=0s     max=38.69ms p(90)=0s      p(95)=498.2µs
     http_req_sending...............: avg=50.89µs min=0s med=0s     max=32ms    p(90)=211.1µs p(95)=499.7µs
     http_req_tls_handshaking.......: avg=9.81µs  min=0s med=0s     max=40.99ms p(90)=0s      p(95)=0s
     http_req_waiting...............: avg=4.14ms  min=0s med=3.49ms max=50.99ms p(90)=7.99ms  p(95)=9.5ms
     http_reqs......................: 1161652 2522.818842/s
     iteration_duration.............: avg=1s      min=1s med=1s     max=1.06s   p(90)=1.01s   p(95)=1.01s
     iterations.....................: 290413  630.704711/s
     vus............................: 6       min=6         max=1400
     vus_max........................: 1400    min=1400      max=1400
And here is the graph of the traffic: