Code coverage
Definition
The most commonly used way to determine whether the tests we're written are enough and sufficient is code coverage.
Code coverage is a software testing metric that determines the number of lines of code that is successfully validated under a test procedure, which in turn, helps in analyzing how comprehensively a software is verified.
The common metrics that you might see mentioned in your coverage reports include:
- Function coverage: how many of the functions defined have been called
- Statement coverage: how many of the statements in the program have been executed
- Branches coverage: how many of the branches of the control structures (if statements for instance) have been executed
- Condition coverage: how many of the boolean sub-expressions have been tested for a true and a false value
- Line coverage: how many of lines of source code have been tested
Line coverage is the most common one you will see and it's the one tools default to if they don't specify any other types of coverage by name.
IDE specific tooling
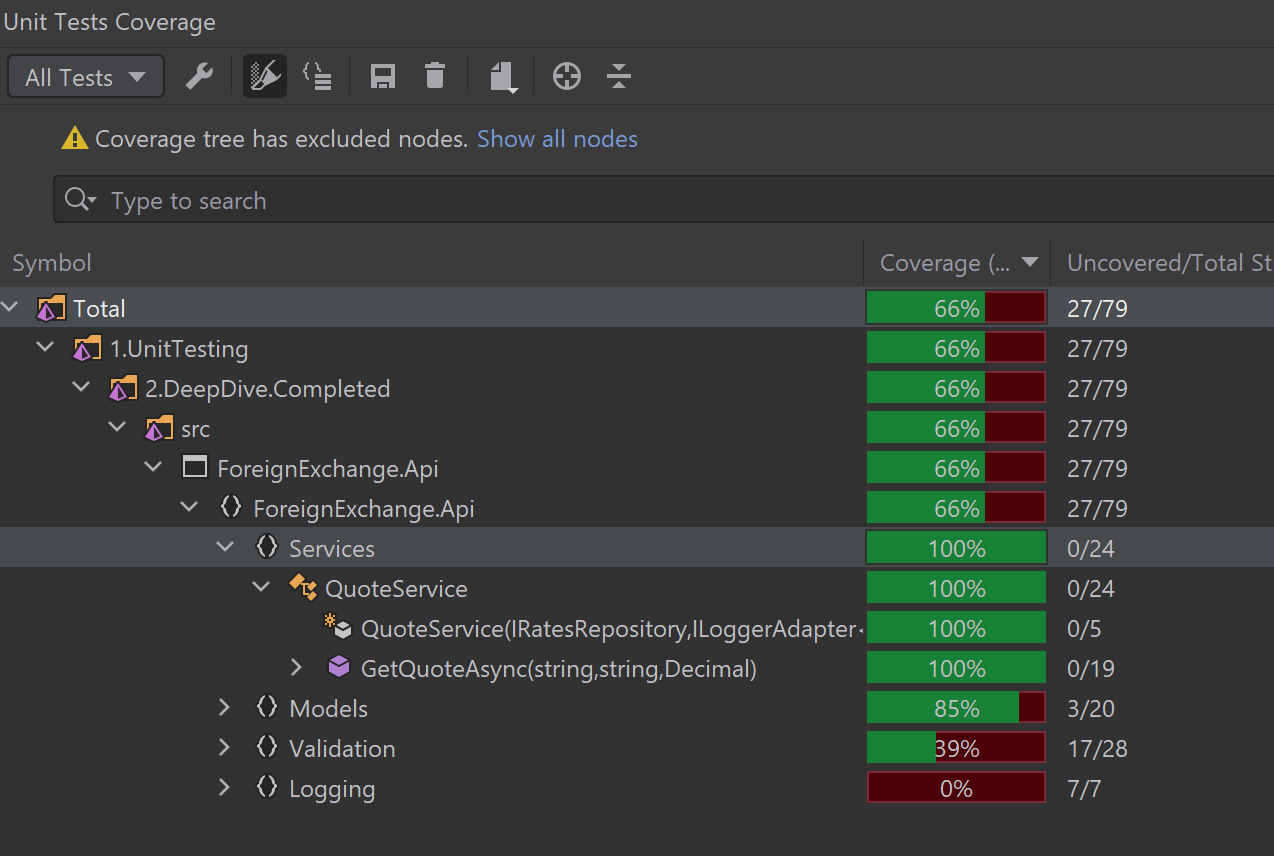
Several IDEs support code coverage collection as one of their features. So does the IDE that I'm using, JetBrains Rider.
Example:
Generic code coverage collection
It is totally understandable if you want your code coverage collection to be done in a way that is not IDE specific. We can achieve that with a Nuget package and a few dotnet command line tools.
The first package we need in our test project is coverlet.collector.
You can install it either by your IDE's Nuget client or using the command:
dotnet add package coverlet.collector
This package will help us collect the code coverage of our project in a format what we can easily use for multiple purposes.
Now let's install the coverlet command-line tool.
dotnet tool install -g coverlet.console
This is a global command that you can access from anywhere in your workstation. To run it against our ForeignExchange.Api.Tests.Unit project simply open the terminal in the project repository and run:
dotnet build
coverlet .\bin\Debug\net6.0\ForeignExchange.Api.Tests.Unit.dll --target "dotnet" --targetargs "test --no-build"
You will see the following result in the console:
+---------------------+--------+--------+--------+
| Module              | Line   | Branch | Method |
+---------------------+--------+--------+--------+
| ForeignExchange.Api | 28.97% | 50%    | 50%    |
+---------------------+--------+--------+--------+

+---------+--------+--------+--------+
|         | Line   | Branch | Method |
+---------+--------+--------+--------+
| Total   | 28.97% | 50%    | 50%    |
+---------+--------+--------+--------+
| Average | 28.97% | 50%    | 50%    |
+---------+--------+--------+--------+
There is also a coverage.json file generated, which you can parse and get all that information too.
This can be really useful when you're collecting code coverage as part of your Continuous Integration pipeline.
Excluding items from code coverage
You can exclude specific items like classes or methods from code coverage in two ways.
- Apply an
[ExcludeFromCodeCoverage]attribute on the item - Append the
--excludeparameter at thecoverletcommand like this:--exclude "[*]ForeignExchange.Api.Repositories"
Another way to collect the code coverage is by using the XPlat Code Coverage collector. This will generate a Cobertura xml file.
To do that run:
dotnet test --collect:"XPlat Code Coverage"
This command will run our tests and generate a coverage.cobertura.xml file that can be found under \TestResults\<random-guid>\coverage.cobertura.xml.
You can parse and use the this file any way you want but because the Cobertura coverage report is a standardized format, there are tools that can use it to generate reports out of it.
Generating a site to visualize code coverage
A developer by the name of Daniel Palme has created an excellent tool that can take that Cobertura report xml and generate different types of things out of it. One of them is a website that can help us visualize how our code is covered.
To install the tool simply run:
dotnet tool install -g dotnet-reportgenerator-globaltool
Then you can use the reportgenerator command to create a site out of the file:
reportgenerator -reports:".\TestResults\<the-guid>\coverage.cobertura.xml" -targetdir:"coverageresults" -reporttypes:Html
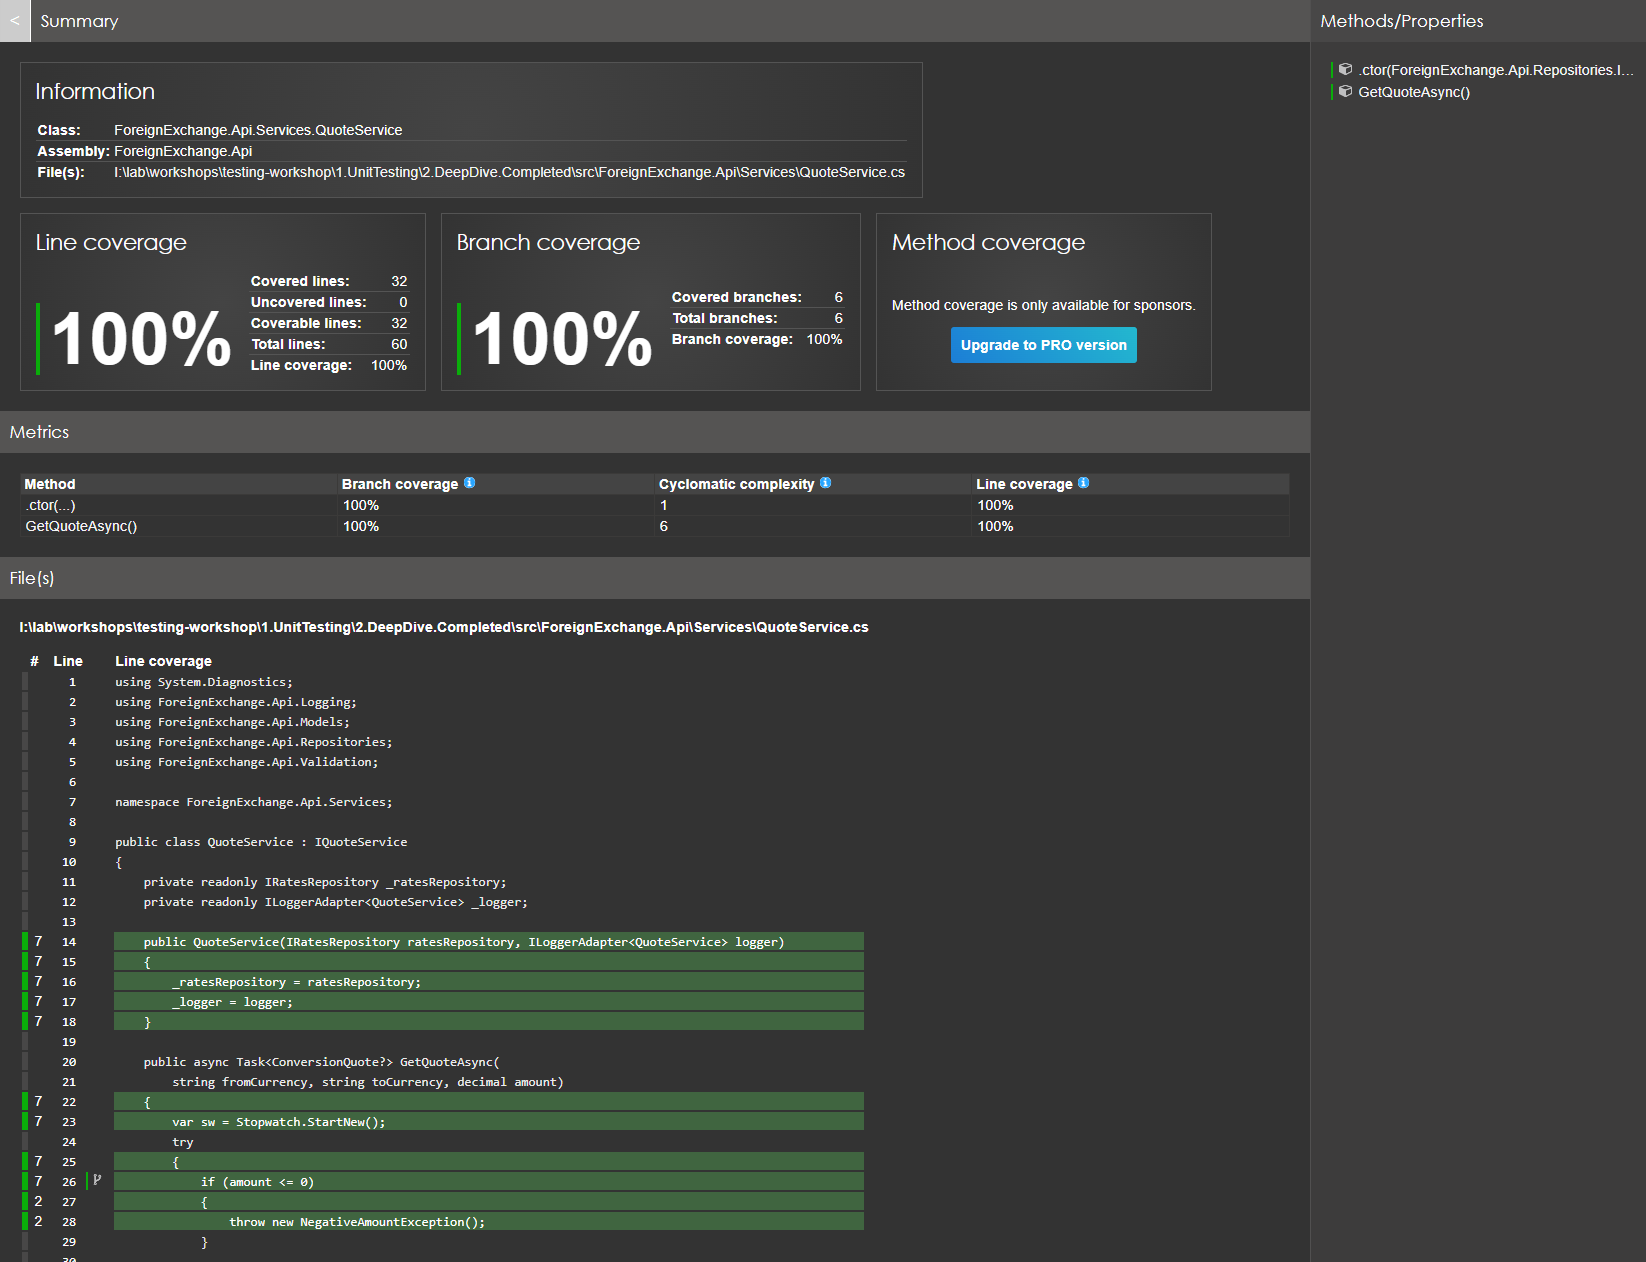
This will create a coverageresults folder. Go into that folder and open the index.html.
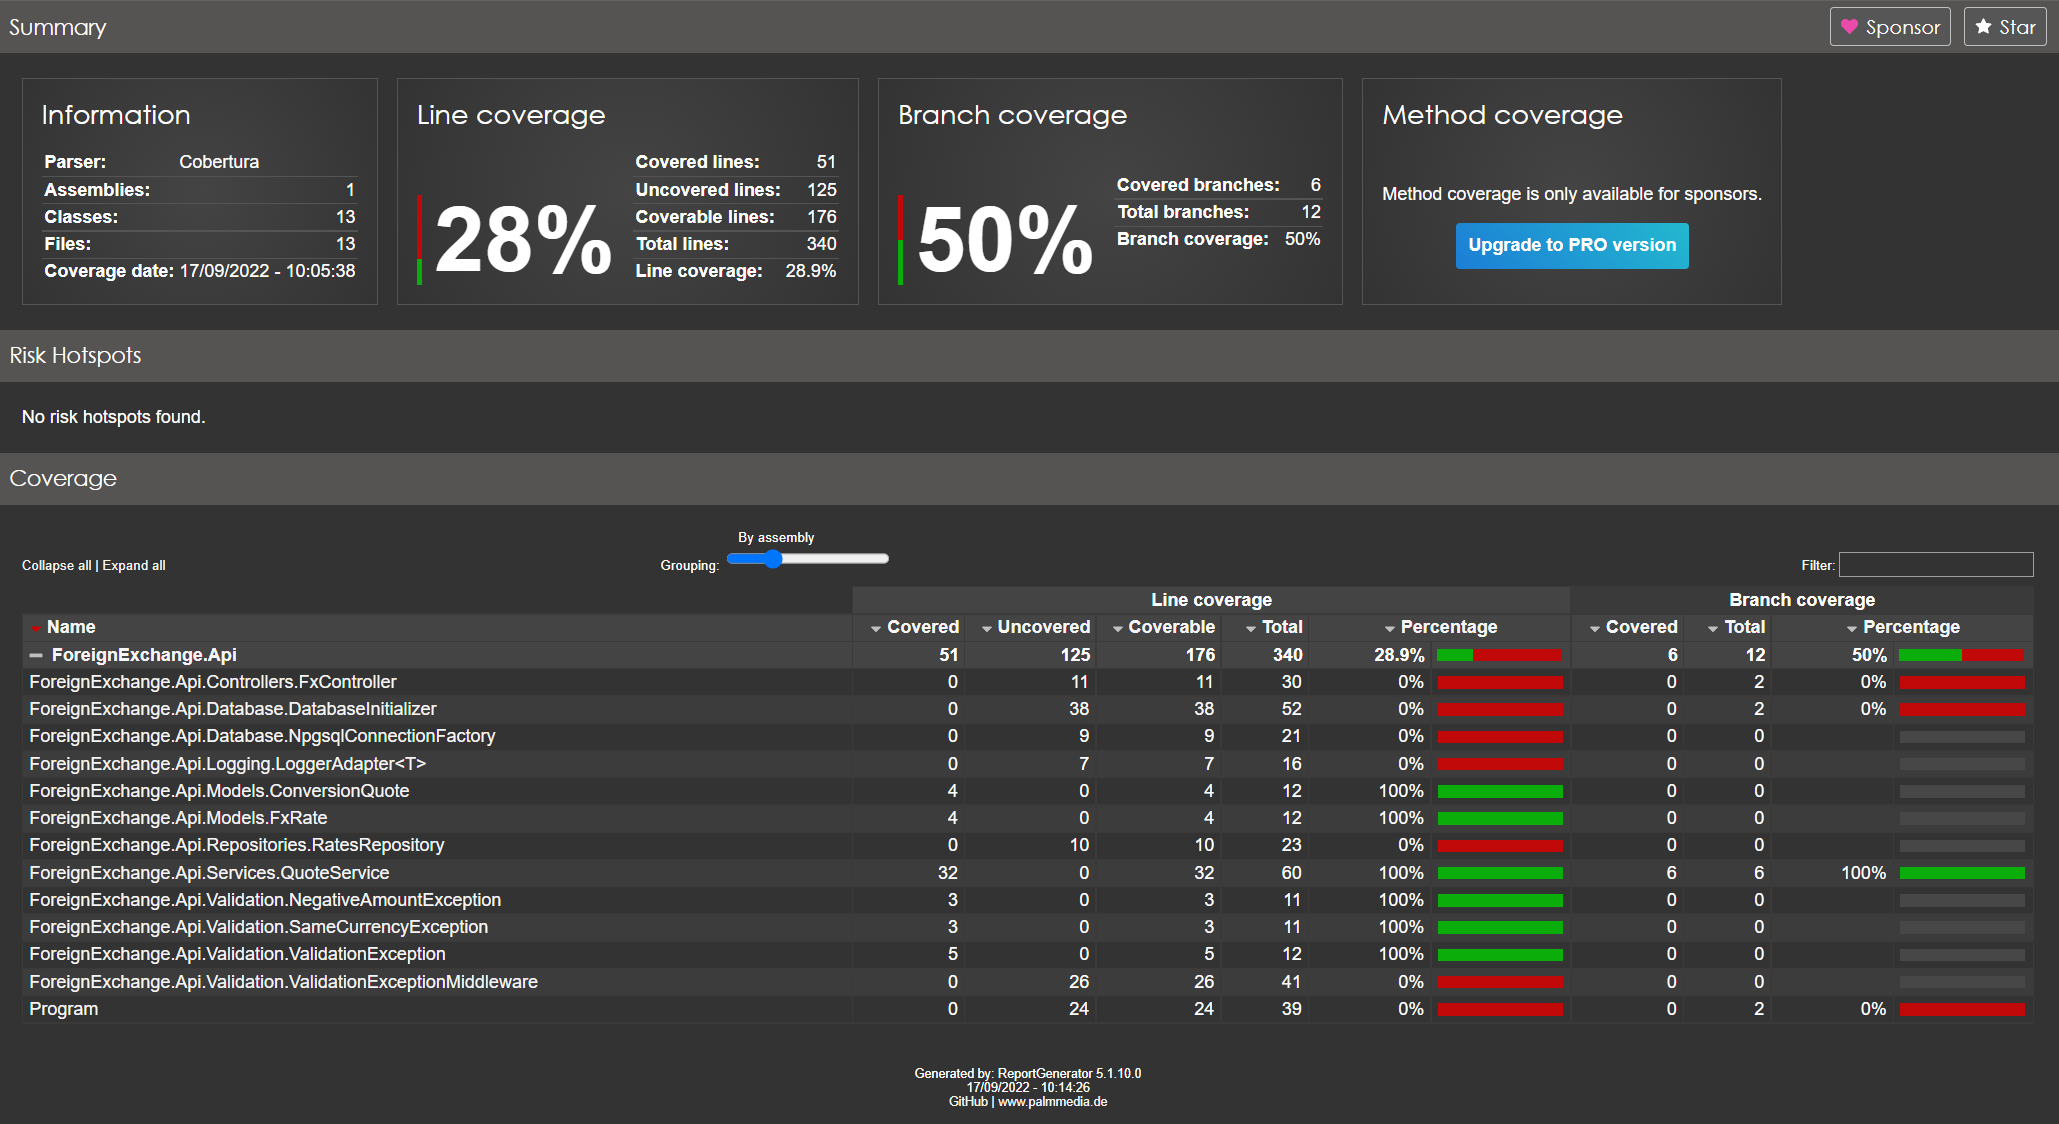
This is a fully interactive website that you can click on and expand to see exactly how your code is covered.